Financial Performance & Analysis Dashboard Suite
Overview
A comprehensive financial analytics suite built in Power BI, providing dynamic Income Statements, Balance Sheets, and project-level Actual vs. Budget analysis for strategic decision-making and in-depth performance review.
Project Details
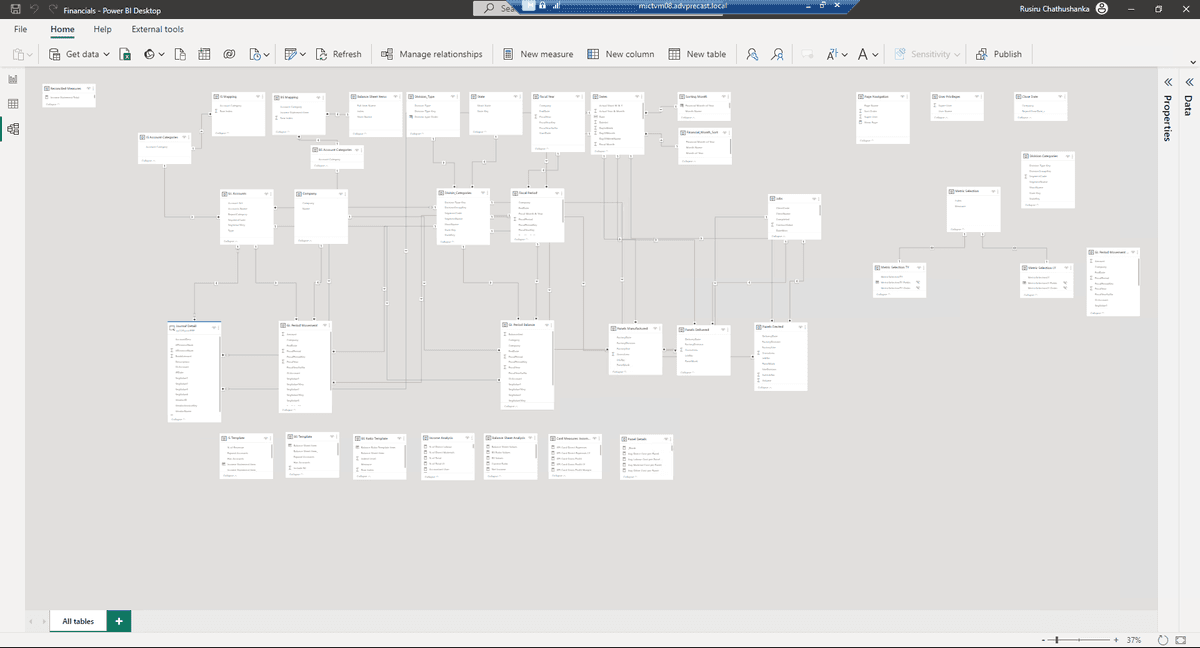
This integrated financial analytics solution provides a holistic and multi-dimensional view of the company's financial health. Built on a robust and scalable Power BI data model, the suite connects various financial data sources to deliver real-time insights into profitability, liquidity, and operational efficiency.
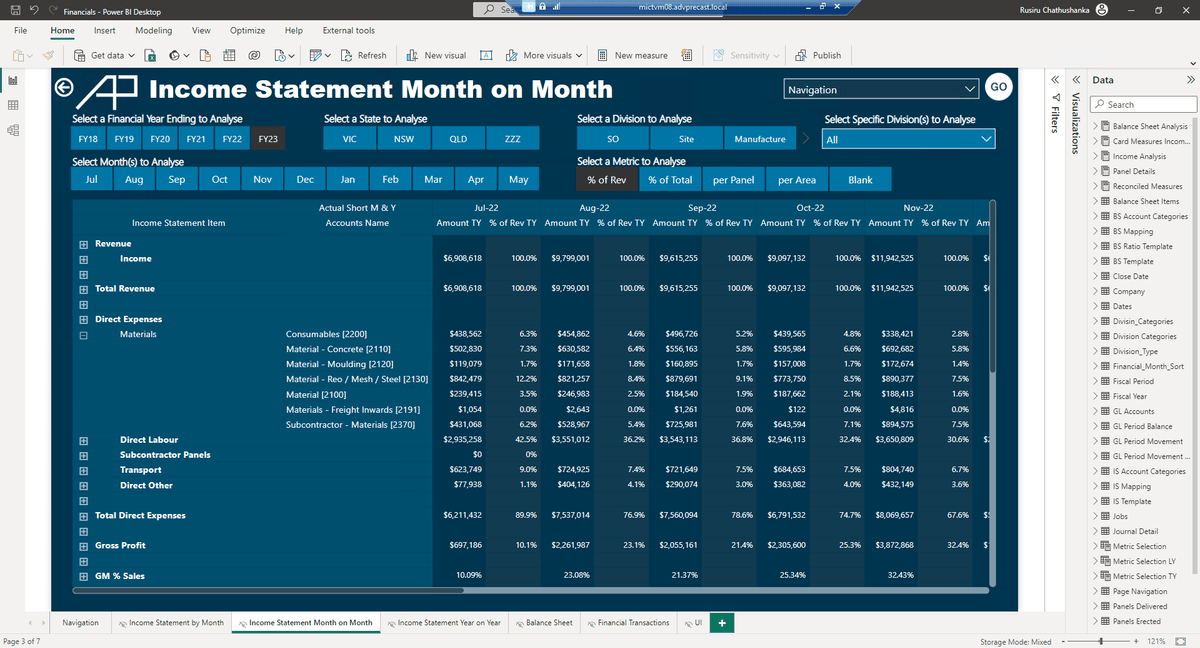
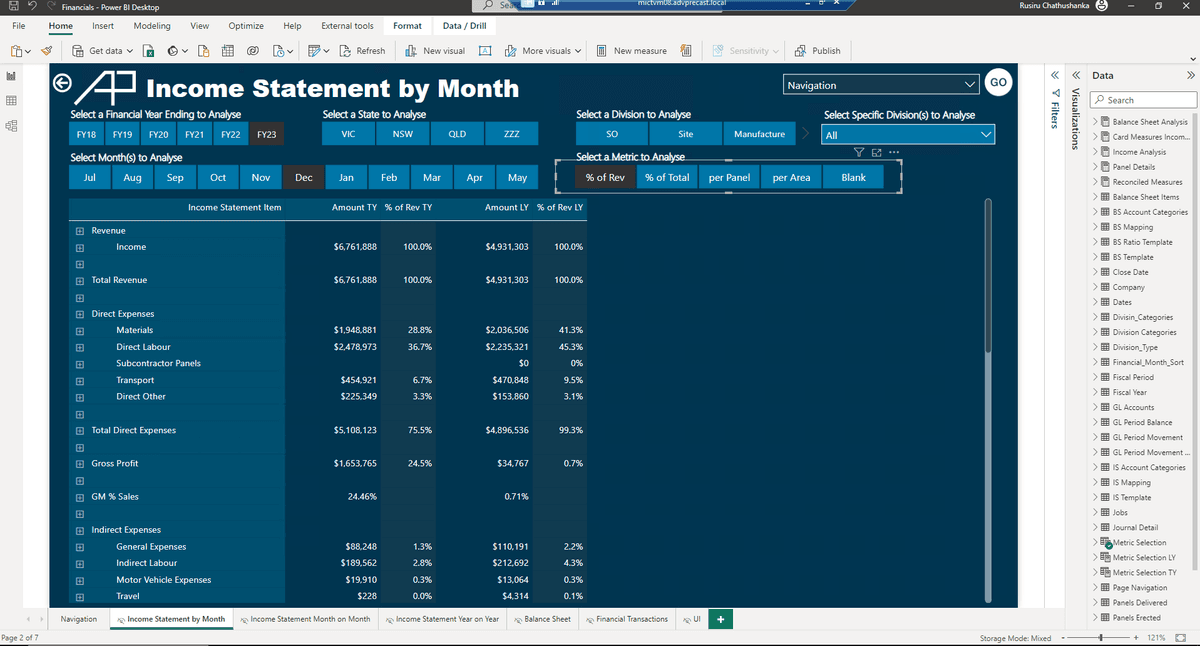
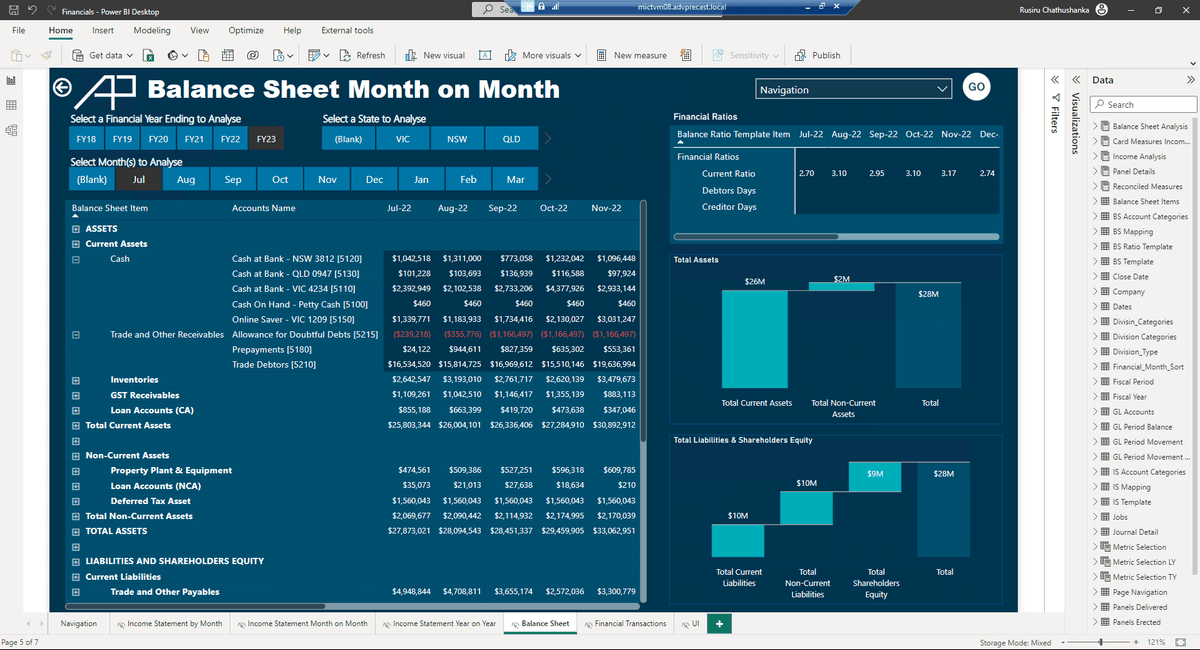
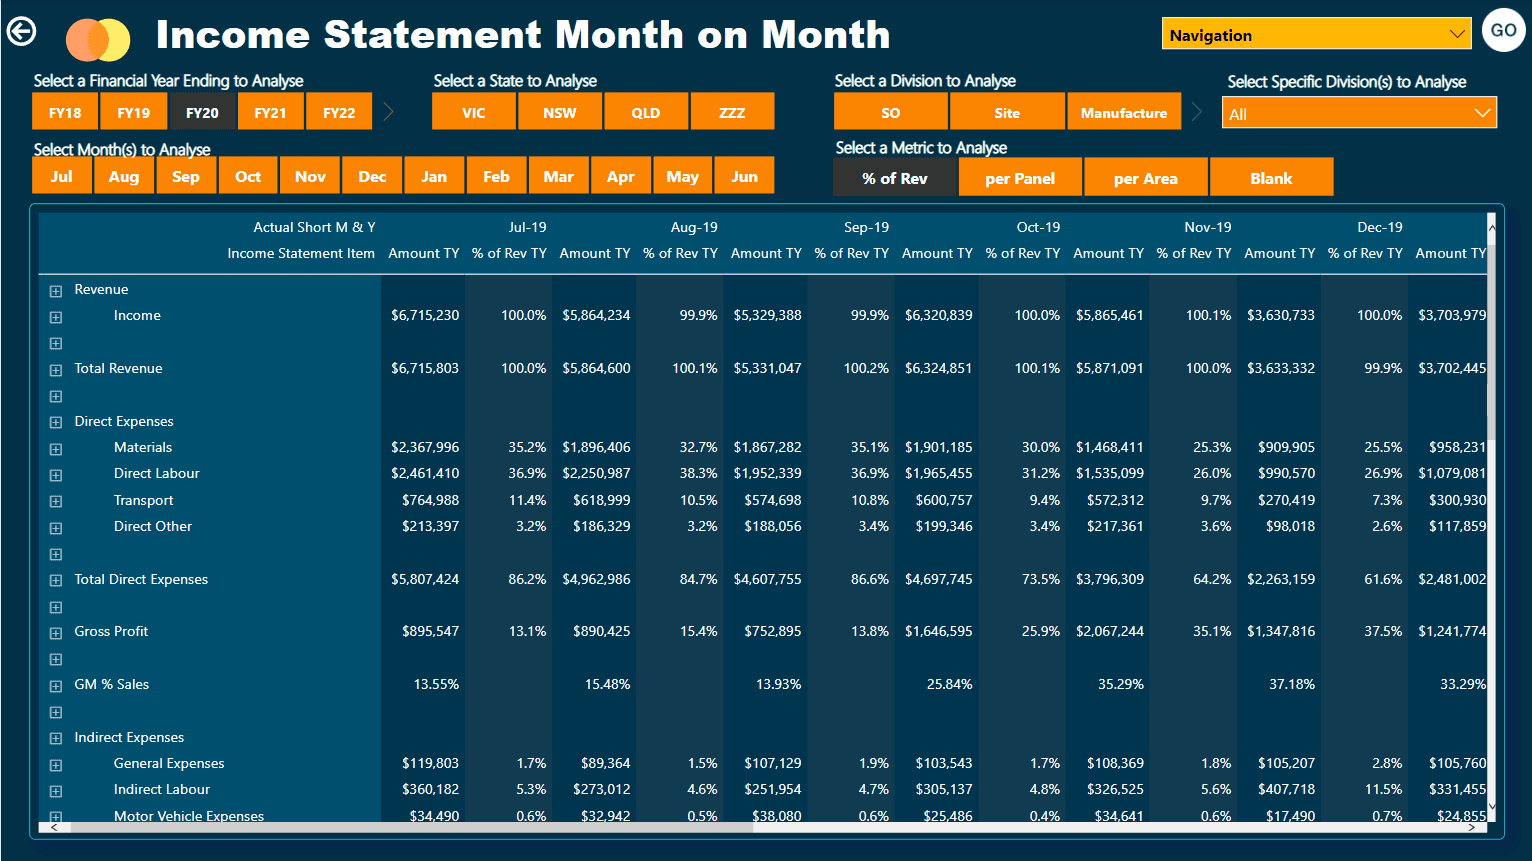
The suite features a dynamic Income Statement with month-on-month and year-on-year comparisons, allowing users to drill down from high-level summaries to individual account details. The interactive Balance Sheet provides a clear breakdown of assets and liabilities, alongside automated calculations of key financial ratios like the Current Ratio and Debtor Days.
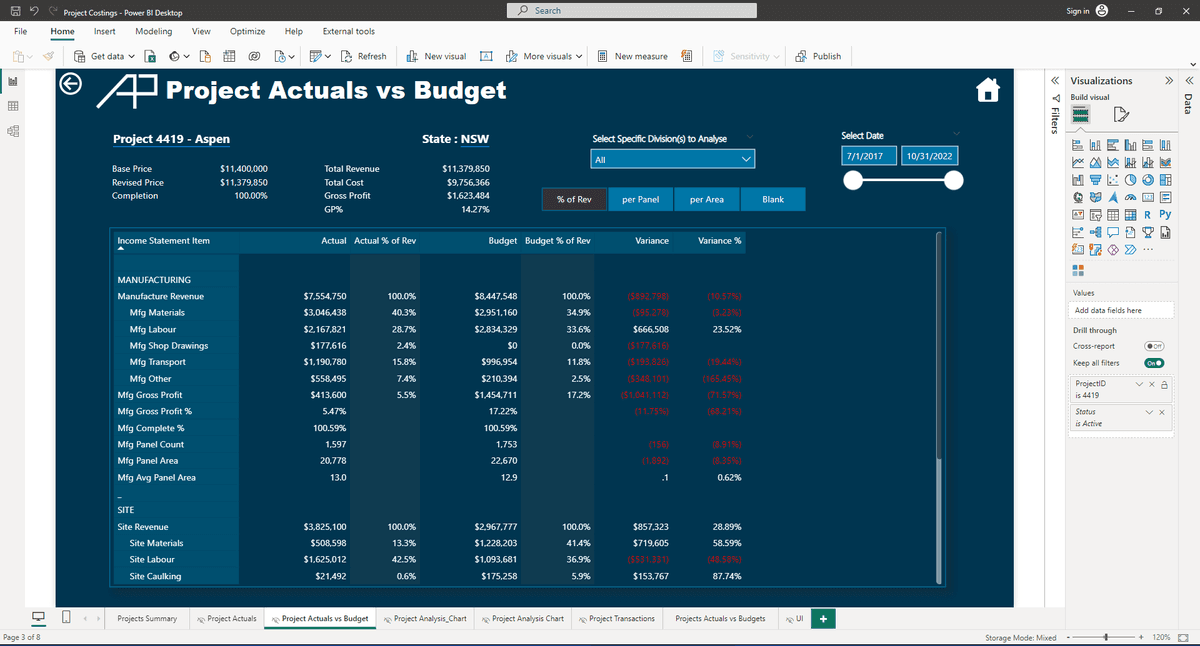
Furthermore, the dashboard includes a powerful Project Costing module for detailed Actual vs. Budget variance analysis. This allows for precise tracking of project profitability by comparing manufacturing and site-level expenses against the budget, enabling proactive cost control and informed strategic planning.
Key Features
- Integrated Financial Reporting (Income Statement & Balance Sheet)
- Project-Level Actual vs. Budget Variance Analysis
- Month-on-Month and Year-on-Year Performance Comparison
- Multi-Level Drill-Down Functionality (Summary to Account Level)
- Automated Financial Ratio Calculations (Current Ratio, Debtor Days, etc.)
- Robust Star Schema Data Model for Performance and Scalability
- Dynamic Filtering by Financial Year, State, and Business Division
- Customizable Metric Views (% of Revenue, per Panel, per Area)
- Interactive Matrix and Chart Visualizations
- Hierarchical data representation for intuitive navigation
Gallery